A report released Tuesday by the office of New York City Comptroller Scott M. Stringer entitled, The New Geography of Jobs: A Blueprint for Strengthening Our Neighborhoods, revealed that, in the midst of a wave of hyper-gentrification, the City's economy is bouncing back.
The report documented business growth from between 2010 - 2105, and found that entrepreneurial activity and new business development in New York's 22 low-income neighborhoods experienced a 41 percent increase. Gentrification also fueled a 100 percent increase in the number of professional and technical services businesses, as well as information businesses, which expanded by 97 percent.
However, according to the report, there were a few red flags: Despite the tremendous business growth in the City's rapidly gentrifying neighborhoods between 2000 and 2015, the benefits of increased economic activity have not been broadly distributed among all of the boroughs' residents. In gentrifying neighborhoods across the five boroughs, 21 percent of Black and Hispanic youth ages 18-24 are still out of school and out of work, and 10 percent of Black and 9 percent of Hispanic adults ages 25-65 are still unemployed.
[perfectpullquote align="right" cite="" link="" color="" class="" size=""]"It is by far the most comprehensive and up-to-date look at the City's evolving economic landscape available today, providing everything from the number and types of businesses in your neighborhood."[/perfectpullquote]
Accompanying the report is a neighborhood-by-neighborhood breakdown, an economic profile by area codes. So what does this more detailed report say about the neighborhoods of Central and East Brooklyn, the trends and the shifts in the years to come?
"It is by far the most comprehensive and up-to-date look at the City's evolving economic landscape available today, providing everything from the number and types of businesses in your neighborhood," said Stringer.
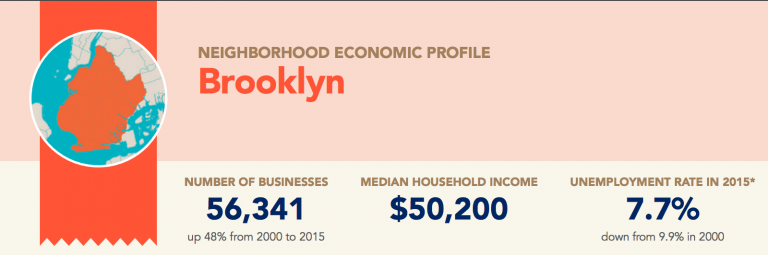
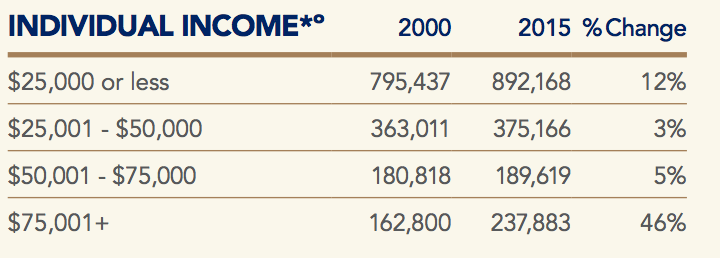
In Brooklyn, as a whole, the number of news business openings increased 48% from 2000 to 2015; The median household income is $50,200, but close to 53% of the population makes $25,000 or less, while 14% of the population makes $70,000 or more. And the unemployment rate is down to 7.7% in 2015, from 9.9% in 2010.
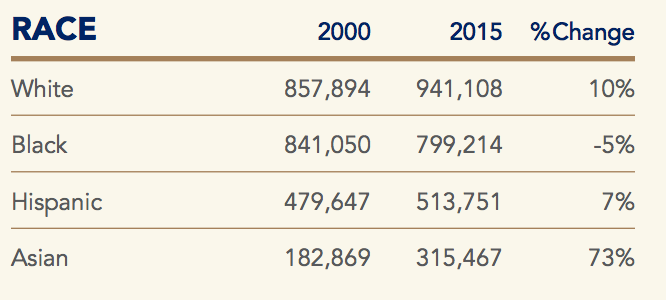
Racially, it's interesting to note that gentrification appears to be fueled not only by an influx of new white residents, but also to some degree, a burgeoning Asian population. As far as race and ethnicity trends, the number of white residents in Brooklyn has increased 41%; the number of black residents has decreased 4%; the number of Latino residents has decreased 16%; and the number of Asian residents has increased 110%*.
By Neighborhood:
Bedford-Stuyvesant-- The NUMBER OF BUSINESSES is up 67% from 2000 to 2015; the MEDIAN HOUSEHOLD INCOME is $35,000, ranked 47 out of 55 neighborhoods; and the UNEMPLOYMENT RATE is 11.9%, down from 17% in 2000. As far as racial and ethnic makeup, the number of whites in Bedford-Stuyvesant has increased 1235%; the number of blacks has decreased 17%; the number of Latinos has increased 16%; and the number of Asians has increased 552%.
Fort Greene and Brooklyn Heights-- The NUMBER OF BUSINESSES is up 51% from 2000 to 2015; the MEDIAN HOUSEHOLD INCOME is $87,800, ranked 7 out of 55 neighborhoods; and the UNEMPLOYMENT RATE is 7.1%, down from 9.8% in 2000. As far as racial and ethnic makeup, the number of whites in the neighborhood has increased 70%; the number of blacks has decreased 28%; the number of Latinos has decreased 8%; and the number of Asians has increased 208%.
Brownsville/Ocean Hill--The NUMBER OF BUSINESSES is up 60% from 2000 to 2015; the MEDIAN HOUSEHOLD INCOME is $26,400, ranked 51 out of 55 neighborhoods; and the UNEMPLOYMENT RATE is 14.6%, down from 20.4% in 2000. As far as racial and ethnic makeup, the number of white residents in Brownsville has increased 273%; the number of black residents has increased 4%; the number of Latino residents has increased 34%; and the number of Asian residents has increased 263%.
East New York/Starrett City--The NUMBER OF BUSINESSES is up 49% from 2000 to 2015; the MEDIAN HOUSEHOLD INCOME is $34,200, ranked 48 out of 55 neighborhoods; and the UNEMPLOYMENT RATE is 6.5%, down from 15.5% in 2000. As far as racial and ethnic makeup, the number of white residents in the neighborhood has decreased 43%; the number of black residents has increased 17%; the number of Latino residents has increased 13%; and the number of Asian residents has increased 39%.
Crown Heights South/Prospect-Lefferts/Wingate--The NUMBER OF BUSINESSES is up 49% from 2000 to 2015; the MEDIAN HOUSEHOLD INCOME is $45,600, ranked 35 out of 55 neighborhoods; and the UNEMPLOYMENT RATE is 7.7%, down from 12.6% in 2000. As far as racial and ethnic makeup, the number of white residents in the neighborhood has increased 160%; the number of black residents has decreased 18%; the number of Latino residents has increased 3%; and the number of Asian residents has increased 341%.
Crown Heights North/Prospect Heights--The NUMBER OF BUSINESSES is up 80% from 2000 to 2015; the MEDIAN HOUSEHOLD INCOME is $45,000, ranked 39 out of 55 neighborhoods; and the UNEMPLOYMENT RATE is 6.3%, down from 13.6% in 2000. As far as racial and ethnic makeup, the number of white residents in the neighborhood has increased 203%; the number of black residents has decreased 23%; the number of Latino residents has increased 83%; and the number of Asian residents has increased 118%.
Flatbush/Midwood-- The NUMBER OF BUSINESSES is up 31% from 2000 to 2015; the MEDIAN HOUSEHOLD INCOME is $46,000, ranked 34 out of 55 neighborhoods; and the UNEMPLOYMENT RATE is 7.4%, down from 9.6% in 2000. As far as racial and ethnic makeup, the number of whites in the neighborhood has increased 11%; the number of blacks has decreased 17%; the number of Latinos has decreased 11%; and the number of Asians has increased 26%.
East Flatbush-- The NUMBER OF BUSINESSES is up 32% from 2000 to 2015; the MEDIAN HOUSEHOLD INCOME is $49,200, ranked 30 out of 55 neighborhoods; and the UNEMPLOYMENT RATE is 7.1%, down from 10.9% in 2000. As far as racial and ethnic makeup, the number of whites in the neighborhood has increased 45%; the number of blacks has decreased 3%; the number of Latinos has increased 21%; and the number of Asians has decreased 58%.
These numbers represent dramatic changes in Brooklyn over the last 15 years.
"I believe we need to create more local wealth in all our boroughs, and we can only do that with more innovative, collaborative, and community-centric solutions," Stringer said of the report.
The neighborhood-by-neighborhood report also examines shifts in education, age, gender, workplace, commuting habits and land use. To see the full report, go here.
*Please note: A large percentage jump can appear inflated if the initial number was small to begin with. For example, an increase of 5 residents, from 5 to 10 residents represents a 100% increase; whereas an increase of five residents, from 50 to 55 residents represents a 10% increase. To get an accurate picture of percentage increases and decreases, take note of the initial number.


